
Learning how to read an ETF fact sheet is the quickest way to see what a fund is trying to do, what it owns, what it costs, and how it has behaved. Before buying an ETF, compare its objective, index, holdings, expense ratio, trading details, distributions, and tracking results. The share price alone tells you very little about whether one ETF is a better choice than another.
Have you ever searched for one type of ETF and found several funds that looked almost identical? I have, and this was the part that confused me at first. The names were similar, the charts moved in nearly the same direction, and different fund companies all seemed to offer the same thing. For a beginner, that does not always feel like having more choice. It can feel like being handed five versions of the same answer and being told to spot the difference.
From the publisher: When I first chose an ETF, I mainly checked how its holdings were divided. I wanted to know which companies were inside and how much weight each one received. I did not pay much attention to the expense ratio, dividends, or trading volume, and the share price did not seem especially important. Looking back, I should have compared more than the portfolio. What confused me most was why ETFs from different fund companies could look almost the same yet still have small differences.
I still think the rush to launch competing ETFs can make the market harder for ordinary investors to understand. More products do not automatically create better choices. So let me show you the few lines that are actually worth checking. A fact sheet is not exciting reading, but it can stop you from buying a fund simply because its name or recent return caught your eye.
Key Takeaways
- Start with the ETF’s objective and benchmark, not its recent return.
- Holdings show what you own; portfolio weights show how strongly each holding can affect you.
- The expense ratio is an ongoing fund cost deducted from fund assets, not a separate bill mailed to you.
- Trading volume and the bid-ask spread help explain how easily and efficiently shares may trade.
- Two ETFs following a similar idea can still differ in index rules, fees, holdings, distributions, liquidity, and tracking results.
What Is an ETF Fact Sheet?
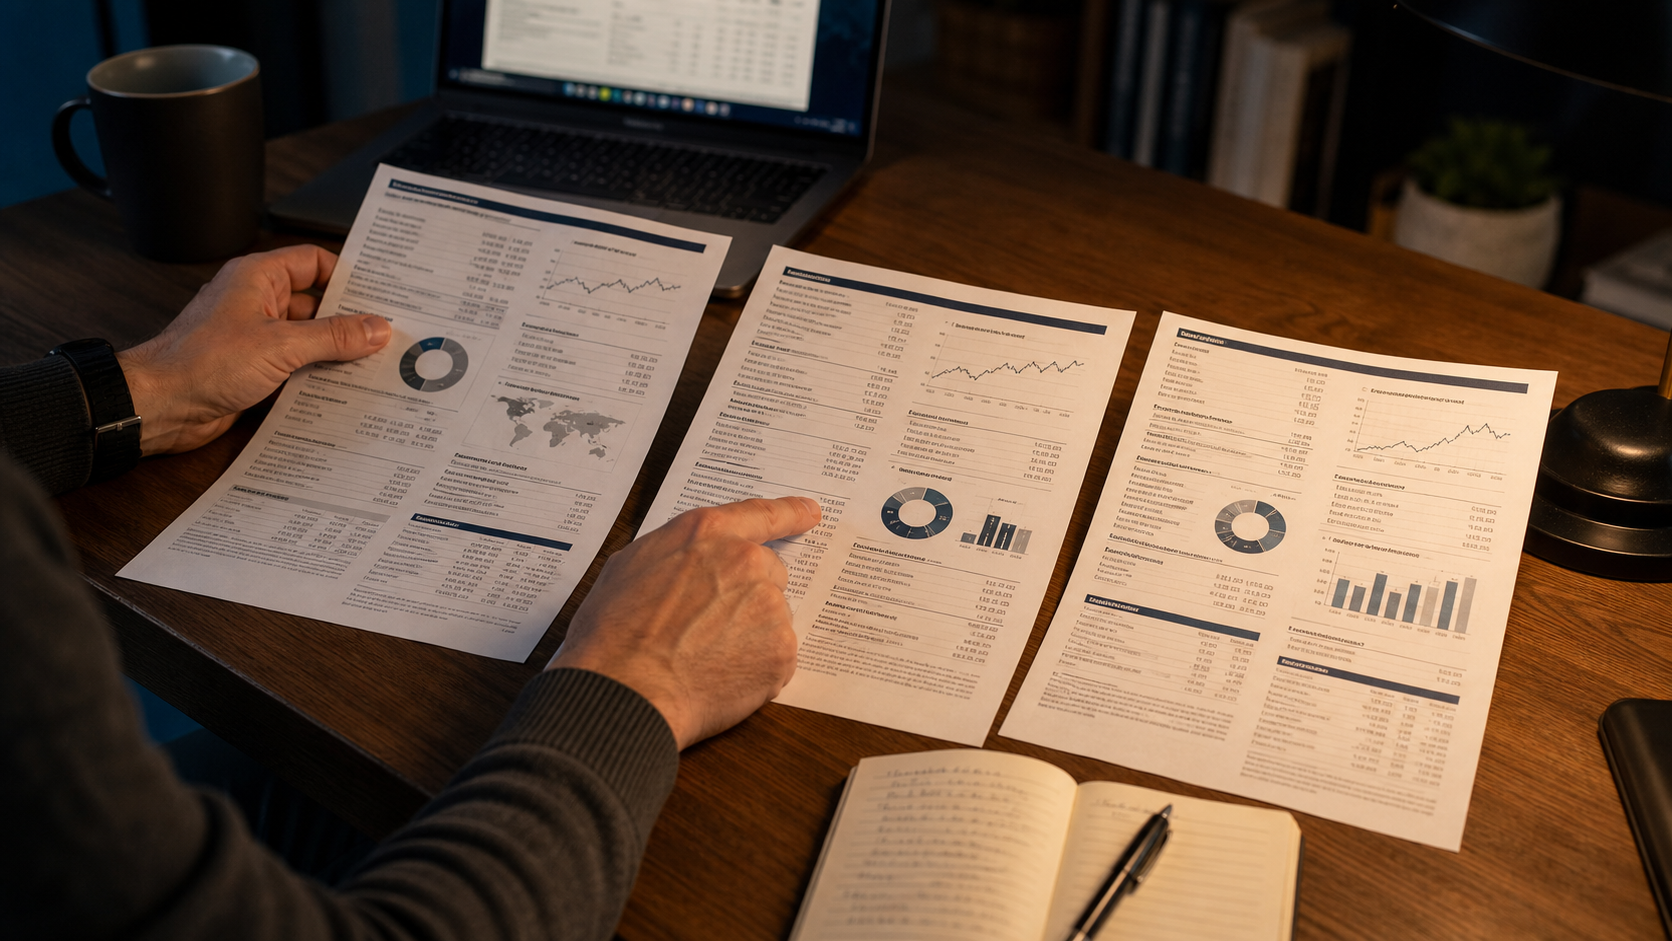
Do you know the short PDF hiding on most ETF product pages? That is usually the fact sheet. It is a summary published by the fund company, and it normally shows the fund’s goal, benchmark, top holdings, sector or country allocation, expense ratio, past performance, distribution information, and basic trading data. Most fact sheets are only a few pages long.
Think of it as the label on a packaged food product. The name on the front tells you what the product is called. The useful details are on the back: ingredients, proportions, cost, and warnings. An ETF name such as “U.S. Growth” or “High Dividend” is only the front label. The fact sheet helps you see what the label actually means.
A fact sheet is only the short version. The prospectus is the longer official document covering the fund’s strategy, fees, and risks. Use the fact sheet to compare funds quickly, then open the prospectus when something is unclear or the strategy is complex.
1. Read the Objective and Benchmark First
“Investment objective” sounds more formal than it needs to. It simply means: What job is this ETF supposed to do? A broad-market ETF may aim to follow large U.S. companies. A dividend ETF may focus on companies meeting certain dividend rules. An active ETF may give a manager more freedom to select investments rather than simply follow an index.
Then comes another word that can stop a beginner: benchmark. You may also see underlying index. Think of it as the rulebook and measuring stick the ETF follows. “Tracks the U.S. stock market” is not precise enough. Two indexes can cover the same general market while using different rules for company size, profitability, dividends, rebalancing, or the maximum weight allowed for one stock.
This is why two ETFs with similar names may not be true copies. Check the exact index name and its rules instead of relying on the product name.
2. Check the Holdings and Their Weights

This part is easier to recognize. Holdings are the stocks, bonds, cash, or other assets owned by the ETF. But do not skip the number beside each name. That number is its weight, or the percentage of the portfolio assigned to it. If one company has a 9% weight, roughly nine dollars of every one hundred dollars in the portfolio is exposed to that company.
This was the part I checked first, and it is still an important place to look. The mistake would be stopping there. A list of 200 stocks may sound diversified, but the largest ten could represent a very large part of the fund. The number of holdings tells you how many names are present; the weights tell you where the real influence sits.
Also check sector and country allocations. Two funds may own many of the same companies while placing very different amounts in them. If you already own another ETF, look for overlap—the same holdings appearing in both funds. More ticker symbols do not always mean more diversification.
3. Understand the Expense Ratio in Dollars
Here is the item I did not pay enough attention to in the beginning: the expense ratio. What is it? It is the annual operating cost of the fund, written as a percentage. It helps pay for portfolio management, administration, recordkeeping, and other fund expenses.
You do not normally receive a separate bill for it. The fund takes the cost from its assets a little at a time, so it is already reflected in the return you receive. That is probably why the fee is easy to overlook—you pay it even though you never press a “Pay fee” button.
Suppose one ETF has an expense ratio of 0.10%. On a $10,000 investment, that equals about $10 per year, assuming the value stayed at $10,000. A 0.50% expense ratio would equal about $50 on the same amount. The actual dollar cost changes as the value of the investment changes, but this simple calculation makes the percentage easier to understand.
The cheapest ETF is not automatically the best. Still, when two funds do nearly the same job, the recurring fee deserves attention because it leaves less money to compound. GSV’s ETF expense ratio guide shows the long-term effect.
4. Separate Share Price From Investment Value
Did you know an ETF trading at $40 is not automatically cheaper than one trading at $400? I did not think share price was especially important when I first looked at ETFs, and in one sense that instinct was right. The share price tells you the cost of one share, not whether the underlying portfolio is a bargain. A fund can split its shares into more pieces and lower the price of each piece without changing the total value of what investors collectively own.
Share price matters mainly when your broker does not offer fractional shares. With $100, you could buy two whole shares of a $40 ETF but not one share of a $400 ETF. That affects accessibility, not fund quality.
Then you may run into the letters NAV. They stand for net asset value, but here is the plain-English version: add up what the fund owns, subtract what it owes, and divide the result by the number of shares. Because ETF shares trade between buyers and sellers during the day, the market price can sit slightly above NAV—a premium—or below NAV—a discount. The fund website generally reports historical premium and discount information.
5. Look at Volume, Liquidity, and the Bid-Ask Spread
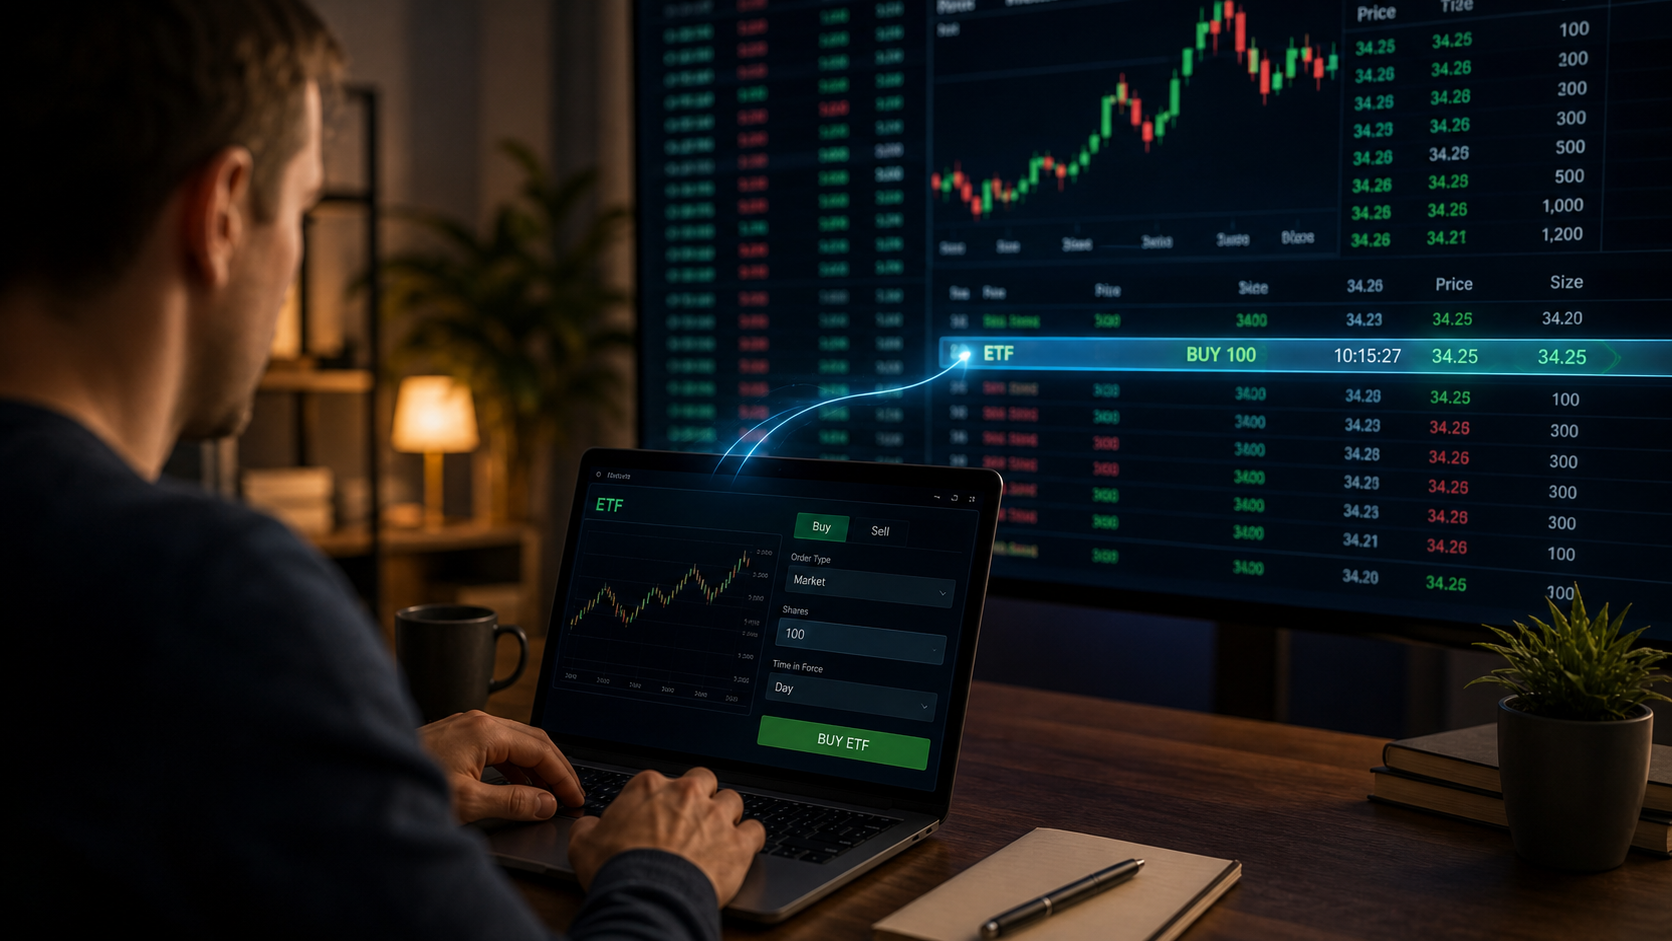
What does “volume” mean on the page? Trading volume is simply the number of ETF shares changing hands during a period, usually one trading day. Higher volume often makes a fund easier to trade, but volume alone does not tell the whole story. The ease of trading the stocks or bonds inside the ETF matters too.
This is where the word liquidity appears. It only means how easily you can buy or sell without causing a large price change. One visible clue is the bid-ask spread. The bid is the highest current price a buyer is offering. The ask is the lowest price a seller will accept. The difference is the spread, and that difference acts like a trading cost.
If buyers offer $50.00 and sellers ask $50.10, the spread is $0.10 per share. A narrower spread means the two sides are closer together. With a wider spread, pay closer attention to your order price. GSV’s guide to the bid-ask spread explains why this matters.
6. Read Performance Without Chasing It
Now we reach the number most of us want to check first: return. Fact sheets often show returns for one year, three years, five years, ten years, and since the fund began. Those figures are useful for comparison, but the brightest number on the page is not a forecast. It tells you what happened under past market conditions, not what you are promised next.
Compare the ETF’s return with its stated benchmark over the same periods. The gap between them is often called the fund’s tracking difference. An index ETF usually trails its benchmark somewhat because of expenses, trading costs, taxes, cash holdings, and the practical work of maintaining the portfolio. GSV’s guide to ETF tracking error explains how consistently that difference varies.
Also notice the time period. A new ETF may show only a short, favorable record, while an older fund has already lived through several kinds of markets.
7. Understand Dividends and Distributions
What about dividends? An ETF may receive dividends from stocks or interest from bonds and pass that income to shareholders as a distribution. The distribution yield is an estimate based on recent payments and the fund’s price. It is not a guaranteed interest rate, even when the percentage looks precise.
A high yield can come with slower growth, concentrated risk, or a payment that may not continue. If income is your goal, look beyond the percentage and ask what produces it. GSV’s dividend ETF guide explains that trade-off.
8. Compare Similar ETFs Side by Side

When several fund companies offer similar ETFs, do not ask only, “Which company is best?” Ask which fund best fits the job you need done. Put the fact sheets next to each other and compare the same fields in the same order.
| Item | What It Means | Question to Ask |
|---|---|---|
| Objective and index | The fund’s intended job and rulebook | Are these funds truly following the same strategy? |
| Holdings and weights | What you actually own and in what proportions | Is one fund more concentrated or overlapping? |
| Expense ratio | Ongoing fund operating cost | What does the percentage equal on my investment? |
| Volume and spread | Clues about trading ease and transaction cost | Can I trade at a reasonable price? |
| Tracking results | How the fund behaved relative to its benchmark | Has it followed the index reasonably closely? |
| Distributions | Income passed to shareholders | Do I need income, and what creates the yield? |
A Simple Five-Minute ETF Fact Sheet Routine
- Read the objective and name the benchmark. Make sure competing ETFs really follow the same rules.
- Inspect the top holdings and weights. Look for concentration and overlap.
- Convert the expense ratio into dollars. Multiply your investment by the fee percentage.
- Check the spread and trading data. These affect the price at which you enter or leave.
- Compare performance with the benchmark, then read the risks. Do not judge a fund only by its best recent year.
How This Guide Was Verified
- Investor.gov: Updated Investor Bulletin on ETFs
- Investor.gov: How to Read a Fund or ETF Shareholder Report
- SEC: ETF Disclosure Requirements
- FINRA: Exchange-Traded Funds and Products
Final Thoughts
If I were choosing that first ETF again, I would still begin with the holdings. I would just refuse to stop there. I would ask what index sets the rules, what the fund costs, how easily it trades, whether it follows its benchmark well, and whether its distributions suit what I actually want.
Several fund companies may race to release similar ETFs, and I understand why that can feel negative from an investor’s point of view. The extra choice creates extra homework. But the answer is not to memorize every product. It is to use the same short comparison routine each time. Once you know what each line on the fact sheet means, the differences stop looking like fine print and start looking like decisions.
Frequently Asked Questions
Where can I find an ETF fact sheet?
Search the ETF ticker on the official fund company’s website. The product page usually links to the fact sheet, summary prospectus, full prospectus, holdings, distributions, and premium or discount history.
Is the ETF with the lowest expense ratio always best?
No. Cost matters, especially when funds perform similar jobs, but also compare the index rules, holdings, tracking results, bid-ask spread, distributions, and how the fund fits your portfolio.
Continue Learning
- What Is an ETF and How Does It Work?
- ETF Expense Ratio Explained
- What Is ETF Tracking Error?
- What Is Diversification?
- What Is a Limit Order?
Disclaimer
This article is for general investing education only. It is not personalized financial, tax, legal, or investment advice. ETF costs, holdings, prices, distributions, and strategies can change. Review the fund’s current official documents before investing. Investing involves risk, including possible loss of principal.