

Market breadth tells you how many stocks are actually taking part in a market move. The index may be rising, but is the whole market moving with it—or are three or four giant companies doing most of the work?
Have you ever looked at a green index and then opened your account to find that most of your stocks were flat or falling? When the market rises, somehow mine does not. When the market falls, mine seems to fall even harder. Most investors have muttered something like that at least once.
It is frustrating. You may blame “the market” and wonder why your portfolio seems to be living in a different world. Honestly, that reaction is human. The annoying part is that the feeling can be real even when the index number is also correct.
But the index is not lying, and neither is your account. They may simply be measuring different things. A market-cap-weighted index can climb because a few very large companies rise enough to outweigh dozens or hundreds of weaker stocks. Market breadth helps us look underneath that one headline number.
It will not tell us the exact day a rally ends. What it can do is answer a more useful question: how many stocks are holding this market up?
Key Takeaways
- Market breadth measures participation, not simply whether an index rose or fell.
- Advancing versus declining stocks is the foundation of several breadth indicators.
- Broad participation can confirm a trend; narrow leadership can make an index more dependent on a few companies.
- Divergence is useful context, but it can persist for months and is not a precise timing signal.
- Investors should combine breadth with earnings, valuation, trend, and portfolio concentration.
What Is Market Breadth?
An index compresses many stocks into a single number. The S&P 500, for example, can rise because hundreds of members advance together. It can also rise because a small group of its biggest companies gains enough to cancel out weakness elsewhere.
That is where market breadth comes in. It counts participation. Common measures compare rising stocks with falling stocks, track how many stocks sit above a moving average, count new highs and new lows, or compare trading volume in winners and losers.
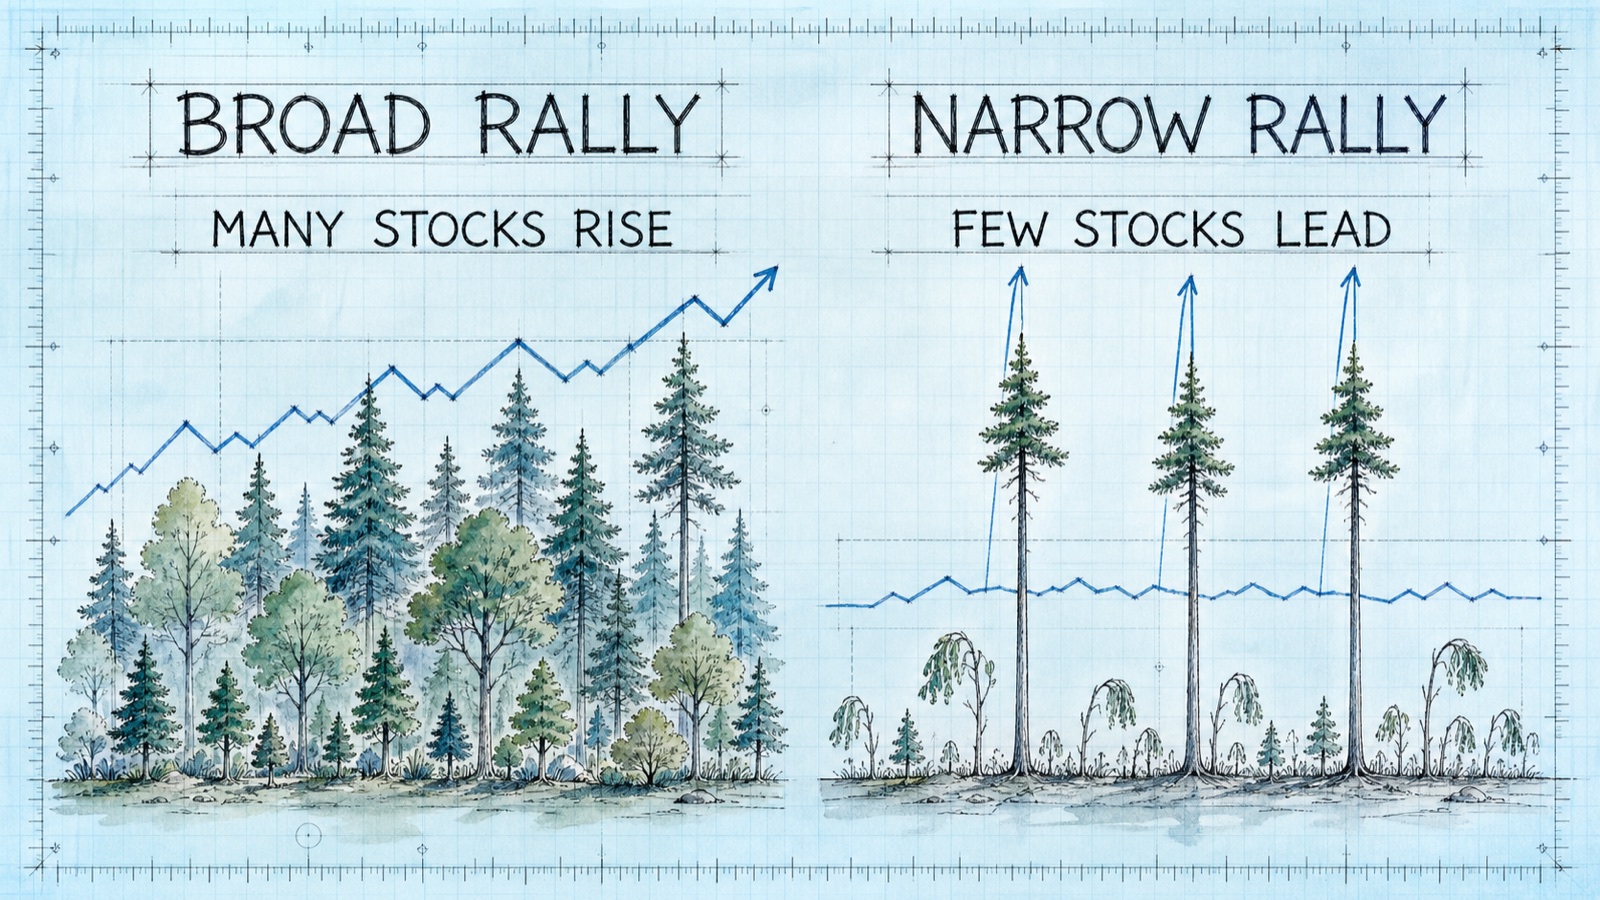
Think of a table. Four sturdy legs make the weight feel secure. One enormous leg might hold it up for a while, but you would keep looking at that one leg, wouldn’t you? A narrow rally is similar. It can keep going, but the index becomes more dependent on a small number of leaders.
Broad Rally vs Narrow Rally
A broad rally occurs when many stocks, industries, and company sizes participate. Advancers consistently outnumber decliners, more securities establish uptrends, and volume supports the move. This often suggests that investors see opportunity beyond one fashionable theme.
A narrow rally occurs when a small group produces a large share of the index gain. That can happen in a market-cap-weighted index because larger companies receive more influence. GSV’s guide to market capitalization explains why a 2% move in a giant company matters more to the index than the same move in a small member.
Narrow leadership is not automatically bearish. Strong, profitable companies can legitimately lead for long periods. The important point is fragility: if the few leaders stumble before participation expands, there may be fewer advancing stocks available to offset their decline.
| Feature | Broad Rally | Narrow Rally |
|---|---|---|
| Participation | Many stocks and sectors | Small leadership group |
| Index dependence | More distributed | More concentrated |
| Confirmation | Breadth often rises with index | Breadth may lag index |
| Main risk | Broad market reversal | Leaders disappoint before breadth expands |
Why Your Portfolio Can Disagree With the Index
Suppose a large semiconductor company rises sharply while banks, retailers, healthcare companies, and smaller manufacturers fall. If that semiconductor company carries enough index weight, the index can still close higher. An investor who owns mostly the other groups sees red.
That disconnect can feel personal. You study companies, hold what you believe are solid stocks, and then the news says “the market rose today.” Meanwhile, your account did not get the message. Sigh. It is easy to feel that the market is being unfair.
Market breadth does not erase that disappointment, but it explains it. The headline index describes the weighted result. Your portfolio describes the particular companies and weights you own. Unless your holdings match the index exactly, the two do not owe you the same return. And yes, on some days your stocks really can miss most of the upside and absorb more of the downside.
This also works in the opposite direction. Your stocks may rise on a day when the index falls. Before blaming the entire market—or congratulating ourselves too quickly—it helps to ask which stocks and sectors actually moved.
How the Advance-Decline Line Works
The advance-decline line, usually shortened to the A-D line, starts with one simple question: did more stocks rise or fall today? The daily calculation is:
Net advances = advancing stocks − declining stocks
If 320 stocks rise and 180 fall, net advances equal +140. Add that number to yesterday’s running total and the A-D line moves higher. If more stocks fall than rise, the daily number is negative. That is all the formula is doing—keeping a running score of participation.
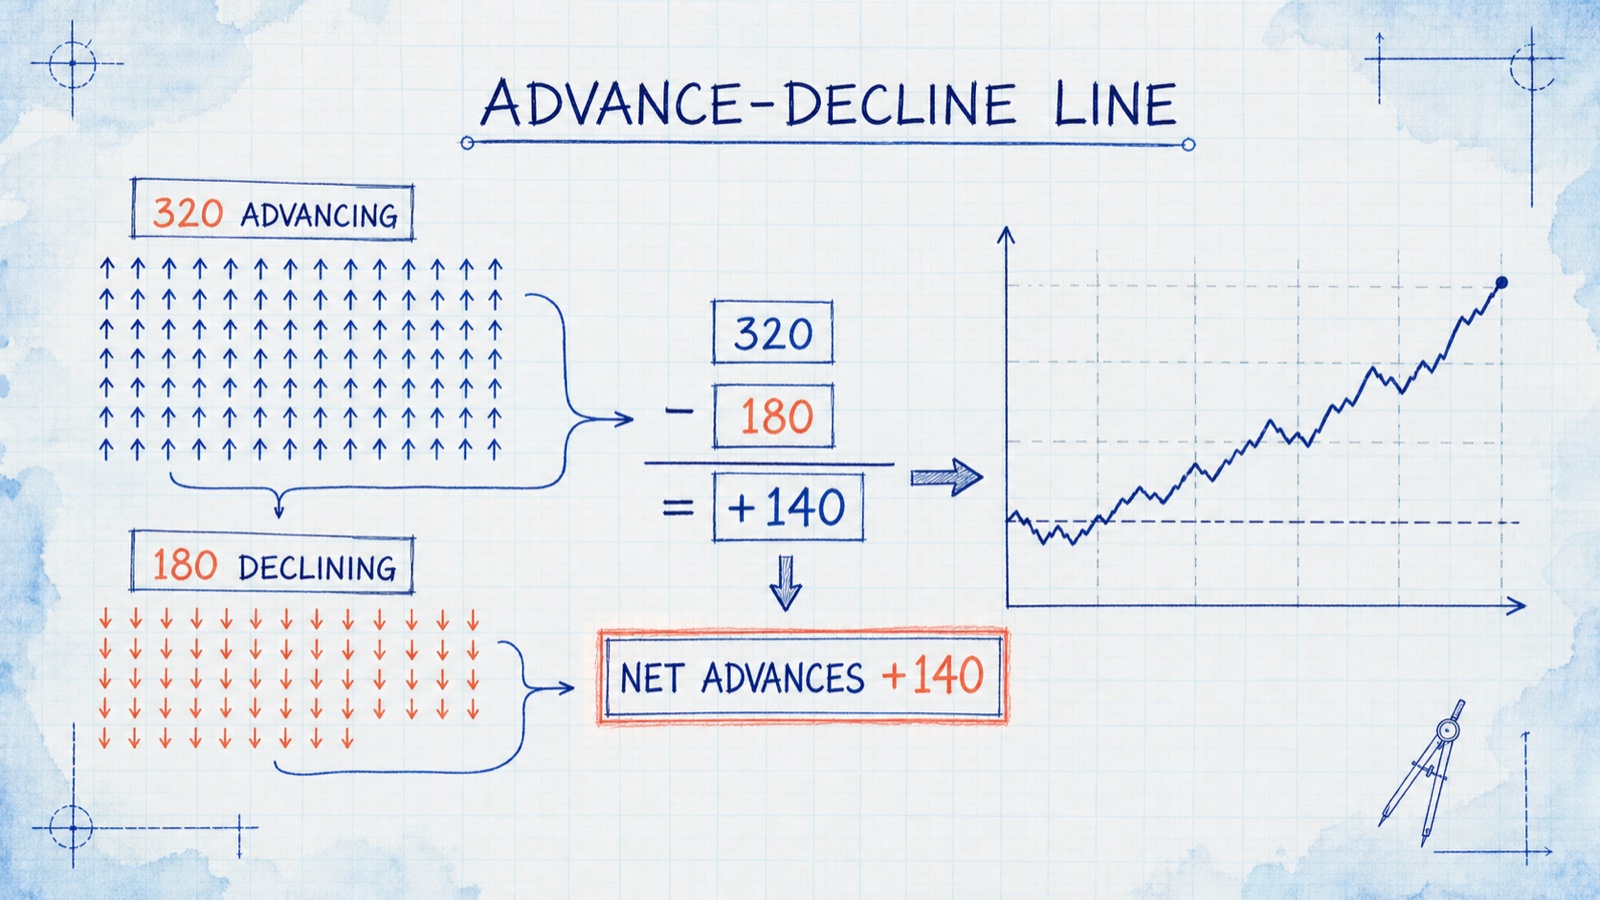
Nasdaq defines advance-decline measurement as the number of issues above their previous closes minus the number below. A rising A-D line means participation has generally favored advancing stocks. A falling line means declining stocks have been more numerous.
The universe must be consistent. An NYSE exchange-wide line and an S&P 500 member line do not measure exactly the same securities. Exchange data can include funds, preferred securities, and other listings, so investors should know what a provider counts before comparing two charts.
Why the Cumulative Line Matters
A single day can be noisy. Cumulative data show whether participation is strengthening or weakening over time. When both an index and its A-D line make higher highs, participation broadly confirms the advance. When the index rises while the A-D line trends lower, analysts call it a bearish breadth divergence.
Divergence is a warning light, not a countdown clock. Large leaders can keep an index rising for weeks or months after participation weakens. If you sell everything at the first sign of divergence, the market may keep climbing without you. Annoying? Absolutely. That is why breadth is context, not a stand-alone sell button.
Four Useful Market Breadth Indicators
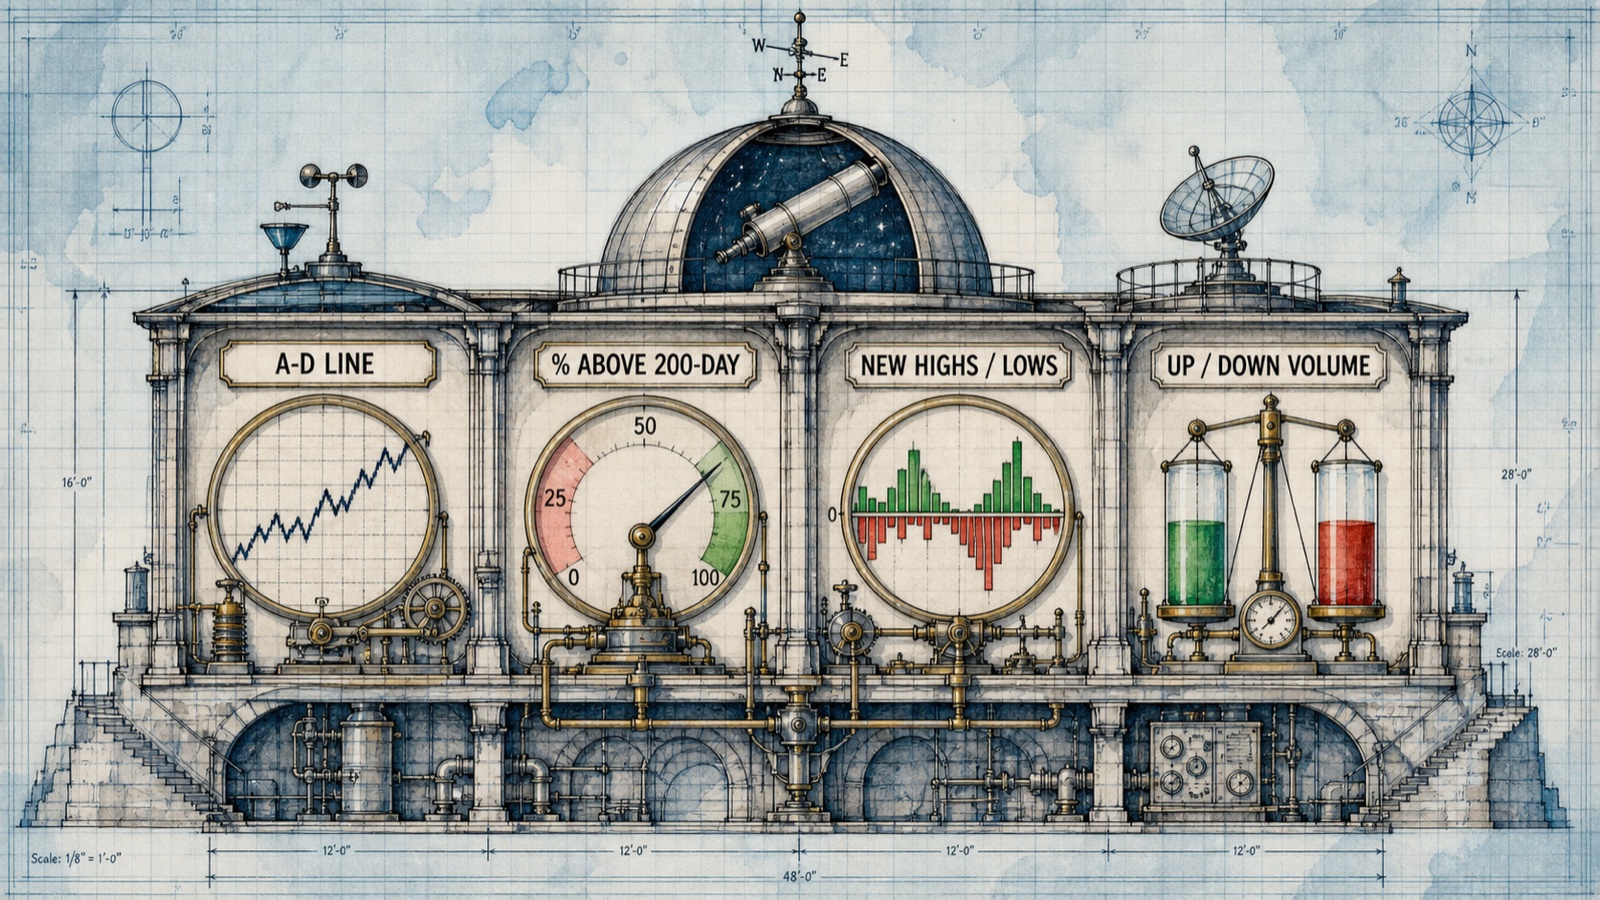
1. Advance-Decline Line
The A-D line measures daily winning stocks against losing stocks and accumulates the difference. It treats each included security equally, which helps reveal participation hidden by market-cap weighting.
2. Percentage Above a Moving Average
This measure asks what share of index members trade above a trend line, often the 50-day or 200-day moving average. A high percentage indicates widespread uptrends. A low percentage indicates that weakness extends across many members.
The time horizon changes the meaning. The 50-day measure reacts more quickly, while the 200-day measure captures longer trends. Neither threshold guarantees what happens next.
3. New Highs vs New Lows
New 52-week highs show how many securities are reaching strong long-term levels; new lows show deep weakness. A rising index accompanied by expanding new highs has different support from one that rises while new lows increase.
4. Up Volume vs Down Volume
Volume breadth weights participation by trading activity. If advancing stocks account for most volume, buyers are supporting the move with substantial participation. A count can look positive while volume remains concentrated in decliners, so the two measures can provide different context.
What Market Breadth Divergence Means
A positive divergence occurs when an index weakens or retests a low while breadth improves. More stocks may be stabilizing beneath a disappointing index headline. A negative divergence occurs when an index reaches a new high while fewer stocks participate.
Compare market breadth with fundamentals. If participation narrows while earnings estimates also weaken and valuations remain demanding, concentration deserves more caution. If large leaders are delivering exceptional profit growth while other groups are beginning to improve, narrow breadth may represent a transition rather than an immediate breakdown.
How Investors Can Use Breadth Without Overreacting
Start by using breadth as a dashboard, not a trading command. Look at several weeks, not one dramatic afternoon. A single session can be distorted by index rebalancing, options expiration, major news, or a rush into one popular sector.
Next, compare the index with what you actually own. If the index is rising because a few technology giants are leading, but your portfolio leans toward dividend stocks or smaller companies, different results are normal. The useful question is not “Why is the market doing this to me?” It is “Which part of the market do I own?”
Then check concentration inside your funds. Two ETFs with different names may still hold many of the same giant companies. If narrow leadership suddenly reverses, several supposedly different funds can fall together. Read the holdings and compare the overlap instead of trusting the labels.
You can also compare cap-weighted and equal-weighted versions of an index. In an equal-weighted index, every member begins with similar influence. If the cap-weighted version races ahead while the equal-weighted version struggles, the biggest companies may be doing much of the lifting.
Finally, do not rebuild a long-term portfolio simply because breadth looks weak. Use it to review risk, not to pretend you can predict tomorrow. Diversification and portfolio rebalancing give a long-term investor firmer rules than one indicator ever will.
Common Market Breadth Mistakes
- Calling narrow breadth a crash signal. Narrow markets can continue rising.
- Mixing data universes. Exchange-wide and index-member data are not interchangeable.
- Relying on one day. Participation trends are more informative than one noisy reading.
- Ignoring index weighting. Market-cap weighting explains how a few companies can dominate returns.
- Using breadth without fundamentals. Earnings, valuation, liquidity, and economic conditions still matter.
How This Guide Was Verified
- Nasdaq: Advance-Decline Definition
- Charles Schwab: Using Breadth to Track Trend Strength
- Investor.gov: Market Index
Final Thoughts
When the index rises and my kind of stocks do not, blaming “the market” can feel easier than opening another chart. I understand that feeling. Sometimes you just look at the screen and think, What more does this company have to do?
Market breadth gives that frustration a clearer shape. Maybe the whole market is strong. Maybe only a few giants are carrying the index. Maybe participation is quietly improving even though the headline still looks weak. Those are very different situations hidden behind one number.
So the next time your portfolio and the index tell different stories, pause before deciding that one of them must be wrong. Ask how many stocks advanced, which sectors led, and whether the largest companies dominated the move. The answer may not make a bad day feel good—but at least you will know what you are actually looking at.
Frequently Asked Questions
Is strong market breadth always bullish?
No. Broad participation can confirm a trend, but markets can still reverse because of valuation, earnings, economic, or policy changes.
Is narrow breadth always bearish?
No. Strong leaders can support an index for a long time. Narrow participation mainly reveals dependence and potential fragility.
What is the easiest breadth indicator?
Advancing stocks versus declining stocks is the simplest starting point. The cumulative A-D line helps show the trend over time.
Can market breadth predict a crash?
No. Weakening breadth may warn that participation is deteriorating, but it cannot reliably predict whether or when a crash will occur.
Continue Learning
Build a stronger market-analysis foundation with these guides.
Educational disclaimer: This article is for general educational purposes only and is not personalized financial, tax, or legal advice. Technical indicators can produce false or early signals. Consider your goals, time horizon, financial situation, and risk tolerance.