

PCE inflation measures how prices change across the goods and services consumed by people in the United States. It matters because the Federal Reserve states its 2% longer-run inflation goal in terms of the annual change in the Personal Consumption Expenditures price index—not the better-known Consumer Price Index.
The next Personal Income and Outlays report is scheduled for July 30, 2026, according to the Bureau of Economic Analysis. That makes this a timely question for investors, savers, and borrowers: what exactly should you look for when the number arrives? This guide explains the measure without turning one data release into a market prediction.
Key Takeaways
- PCE inflation is produced by the Bureau of Economic Analysis and covers a broad range of consumer spending.
- Headline PCE includes food and energy; core PCE excludes them to reveal a less volatile underlying trend.
- PCE and CPI use different data, coverage, and weights, so they can give different readings without either being “wrong.”
- The Fed prefers PCE for its 2% longer-run goal, but policymakers examine many inflation, labor, and activity indicators.
- Markets react to the difference between the release and expectations, not simply to whether inflation rose or fell.
What Is PCE Inflation?
The PCE price index is part of the BEA’s monthly Personal Income and Outlays report. The agency combines information from business surveys, administrative records, and other national-account data to estimate the prices attached to consumer spending. The index includes familiar categories such as groceries, housing, transportation, recreation, and medical care.
Think of PCE inflation as a change in the overall price of a broad, evolving basket. A year-over-year rate compares an index level with the same month one year earlier. A month-over-month rate compares it with the immediately preceding month. Annualized monthly rates may also appear in market commentary, but they are calculations—not a separate official index.
The basket is not a shopping list for one household. Every family experiences inflation differently because spending patterns differ. A renter, homeowner, retiree, commuter, and parent may face very different price pressures even when the national index is unchanged.
That is why this measure is best used to describe economy-wide price change, not to calculate your personal cost of living. GSV’s Consumer Price Index guide explains another national measure that households see more often in headlines.
Headline vs Core PCE Inflation

Headline PCE includes the full consumption basket, including food and energy. It is the broadest answer to the question, “How much did consumer prices change?” Because households actually buy groceries and fuel, headline inflation is essential when assessing purchasing power.
Core PCE removes food and energy categories. Those prices are not excluded because they are unimportant. They are excluded because they can swing sharply due to weather, geopolitics, harvests, refinery outages, and commodity shocks. Removing them can make the underlying trend easier to see.
Core PCE inflation can still move because of housing services, healthcare, travel, financial services, and many other categories. It is not a perfect “clean” number. Policymakers also examine shorter-term momentum and detailed components to judge whether pressure is broadening or narrowing.
A sensible reading uses both versions. Headline PCE tells you what happened across the full basket. Core PCE helps determine whether a volatile food or energy move is masking a more persistent pattern. For an example of how commodity costs can spread through the economy, see Oil Prices and Inflation.
PCE vs CPI: Why the Numbers Differ
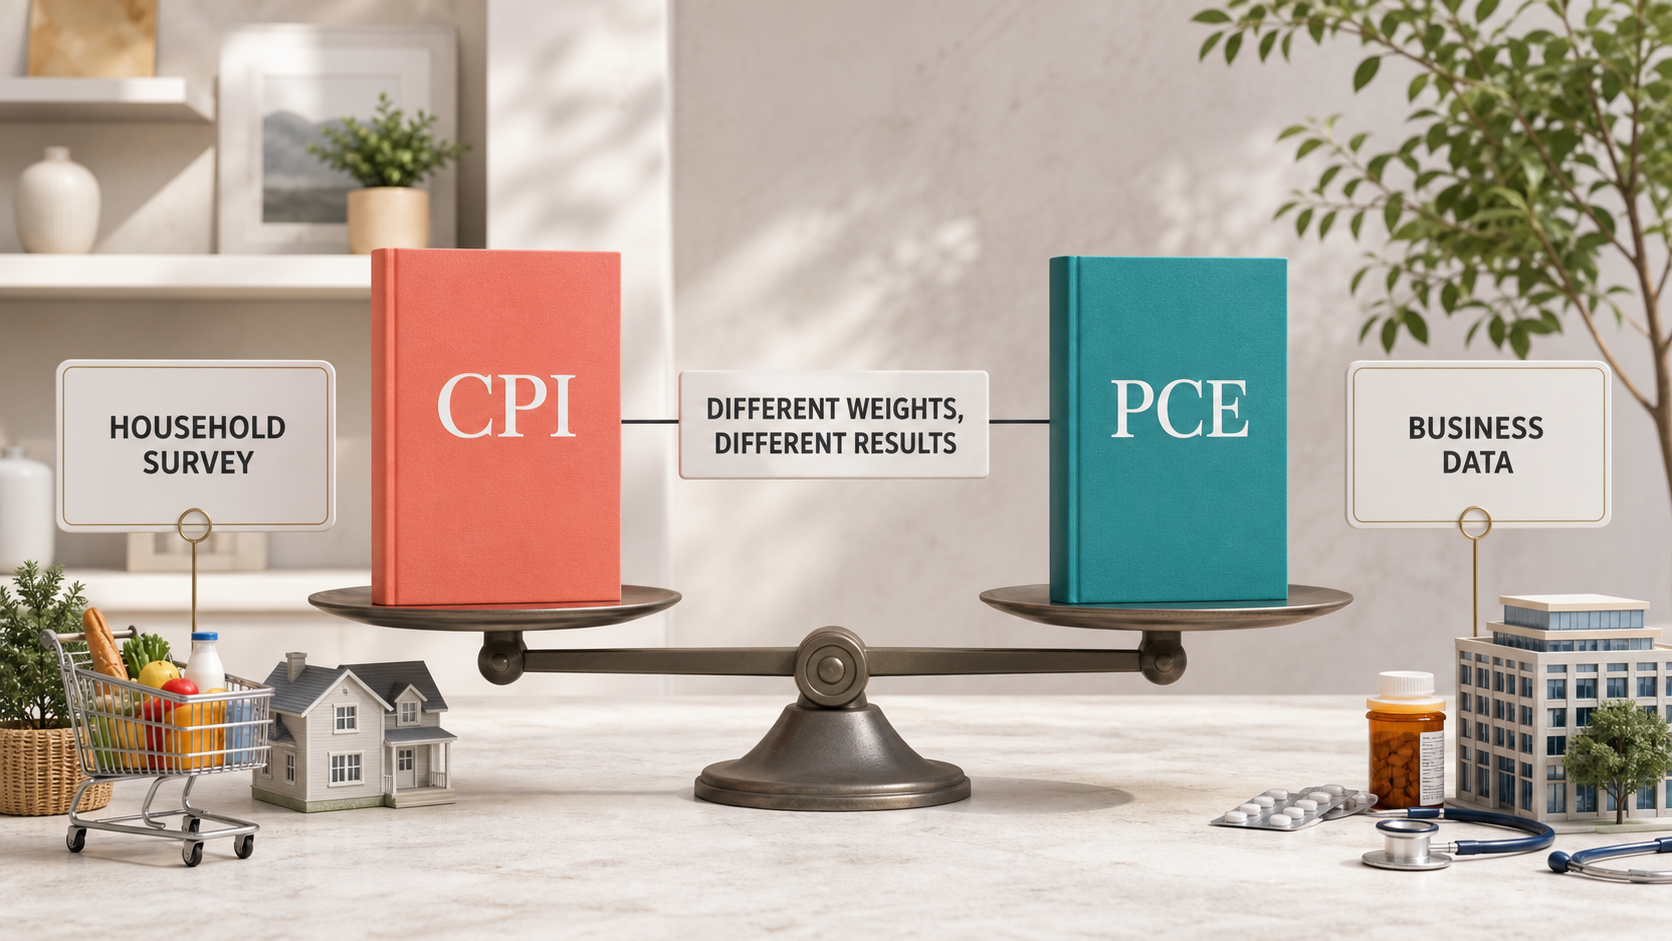
CPI and PCE both measure consumer price change, but they answer the question with different frameworks. CPI is produced by the Bureau of Labor Statistics and emphasizes out-of-pocket purchases by urban consumers. PCE is produced by the BEA and fits consumer spending into the broader national accounts.
Coverage is a major difference. PCE can include spending made on behalf of households, such as certain employer- or government-paid healthcare expenses. CPI focuses more directly on expenses paid by consumers. The two indexes also assign different importance to categories such as housing and medical care.
PCE weights adjust more readily as consumers substitute between goods and services. If the price of one product rises and buyers switch to an alternative, the index can reflect that changing mix. CPI methodology also incorporates substitution in specific ways, but its headline framework and weight updates differ.
| Feature | PCE Price Index | Consumer Price Index |
|---|---|---|
| Producer | Bureau of Economic Analysis | Bureau of Labor Statistics |
| Primary data | Business and national-account data | Household spending patterns and price collection |
| Coverage | Broader spending, including some third-party payments | Primarily out-of-pocket urban consumer purchases |
| Weights | Adapt more readily with spending changes | Different basket and update process |
| Main policy role | Fed’s stated 2% longer-run inflation goal | Major public cost-of-living benchmark |
Neither index is universally “better.” The right measure depends on the question. CPI is highly relevant for household experience and many adjustments in contracts or benefits. PCE inflation offers broad coverage and an adaptable expenditure framework that is useful for monetary policy.
Why the Fed Watches PCE Inflation
The Federal Open Market Committee seeks maximum employment and price stability. Its longer-run strategy defines price stability as 2% inflation over the longer run, measured by the annual change in the PCE price index. That is why investors often call PCE the Fed’s “preferred” gauge.
Three features help explain the preference. First, PCE covers a broad range of spending. Second, its weights respond to changes in consumer behavior. Third, historical data can be revised as more complete information enters the national accounts. Revisions may frustrate anyone seeking a final answer immediately, but they can improve the economic record.
The Fed does not mechanically change rates whenever PCE inflation crosses a line. Officials consider inflation’s direction, breadth, persistence, expectations, labor-market conditions, financial conditions, and risks to the outlook. One month can be noisy, and policy affects the economy with uncertain lags.
Monetary policy influences demand through borrowing costs, asset prices, credit, and expectations. Higher rates can cool interest-sensitive spending; lower rates can support it. Read Inflation and Interest Rates for the transmission mechanism and Fed Rate Decision for a five-step guide to FOMC announcements.
How Markets Read a PCE Inflation Report

1. Compare Headline and Core
Start by identifying whether a move is concentrated in food and energy or visible in the core basket. A divergence does not invalidate either measure; it tells you which parts of consumer prices drove the month.
2. Check Monthly and Yearly Rates
The yearly rate is intuitive, but it changes partly because an old month drops out of the comparison. That “base effect” can cause the annual rate to move even when the latest monthly reading is moderate. Monthly figures provide fresher momentum but are noisier.
3. Compare With Market Expectations
A report is new information only relative to what investors expected. If PCE inflation matches the consensus, bond and stock reactions may be small. A modest number can still disappoint if traders expected something lower; a high number can produce little change if it was already priced in.
4. Read the Components and Revisions
Look beyond the top line. Is pressure concentrated in a few services, or spread across the basket? Were prior months revised? A broad and persistent pattern can influence the policy outlook more than one volatile category.
5. Watch Rates Before Stocks
Shorter-maturity Treasury yields often provide a direct view of changing policy expectations. A hotter-than-expected release can raise expected rates and yields; a cooler release can lower them. The relationship is not guaranteed because growth, debt supply, global risk, and other news also affect bonds. GSV’s Treasury Yields guide explains the benchmark.
How the Signal Reaches Your Money
- Stocks: Changing yields affect discount rates and financing costs. Growth expectations can offset or amplify the move. See Interest Rates and Stocks.
- Bonds: Existing bond prices generally move opposite comparable yields; longer-duration bonds are usually more sensitive.
- Savings: Deposit and money market yields often follow the short-rate cycle with different timing. Compare liquidity and terms in the High-Yield Savings Account guide.
- Borrowing: Floating rates can adjust relatively quickly, while fixed mortgage rates depend heavily on longer-term bond markets.
Do not convert one PCE inflation surprise into an all-or-nothing trade. A durable portfolio should withstand more than one inflation path. Rebalancing, liquidity planning, and diversification generally offer more control than predicting a single release.
Common PCE Inflation Mistakes
- Treating PCE as a personal budget. It is a national aggregate, not your household’s exact experience.
- Ignoring core or headline. Each answers a different, useful question.
- Comparing monthly with yearly rates. They use different time windows.
- Calling every decline “deflation.” Slower positive inflation is disinflation; deflation means the overall price level falls.
- Assuming CPI and PCE should match. Their coverage, source data, and weights differ.
- Trading without checking expectations. Markets react to surprises, not labels alone.
- Ignoring revisions. Updated history can change the apparent trend.
Another mistake is assuming a favorable month ends the inflation debate. Policymakers usually need a body of evidence. Likewise, a disappointing month does not establish a permanent trend. Context and repetition matter more than a single decimal place.
Official Sources
- Bureau of Economic Analysis: PCE Price Index
- Bureau of Economic Analysis: Release Schedule
- Federal Reserve: July 2026 Monetary Policy Report
- Federal Reserve: June 2026 Economic Projections
Final Thoughts
PCE inflation matters because it provides a broad view of consumer prices and anchors the Fed’s stated longer-run inflation goal. Its relationship with CPI is complementary, not competitive: different methods illuminate different parts of the economy.
When a report arrives, read headline, core, monthly, yearly, and expectations together. Then examine components and revisions before drawing conclusions. That process will not predict every market move, but it is far more useful than reacting to one headline.
Frequently Asked Questions
What does PCE stand for?
PCE stands for Personal Consumption Expenditures. The PCE price index measures price changes for goods and services consumed by U.S. households.
Why does the Fed prefer PCE over CPI?
PCE has broad spending coverage, adaptable weights, and integration with the national accounts. The Fed still examines CPI and many other indicators.
What is core PCE?
Core PCE excludes food and energy categories to reduce short-term volatility and help reveal the underlying trend. Headline PCE remains important for actual purchasing power.
Can PCE and CPI move in different directions?
Yes. Different category weights, coverage, data sources, and seasonal patterns can produce different monthly changes.
Does a low PCE reading guarantee rate cuts?
No. The Fed evaluates the broader outlook, labor market, cumulative evidence, financial conditions, and risks. Market expectations also influence how assets react.
Continue Learning
Build the rest of the macro framework.
Educational disclaimer: This article is for general educational purposes only and is not personalized financial, tax, or legal advice. Economic data, release schedules, policy expectations, rates, and market conditions can change. Verify current information with official sources and consider your objectives, time horizon, liquidity needs, and risk tolerance.